.png)
December 2020 Round-Up
- katebrown50
- Jan 1, 2021
- 3 min read
Updated: Jan 3, 2021
Thank you to everyone who participated in the December challenge. This was my first month hosting SVS as a member of the team and I loved seeing all the visualizations on Twitter. Most of the sports visualizations I see on Twitter are skewed towards male athletes/teams, so it was great to see female athletes highlighted this month. It was also nice to this tweet from CJ. I hope more data viz people follow suit and highlight female athletes.
I appreciate that he's looked at his portfolio (which is AMAZING) and realized that he was missing a whole group of amazing athletes. Some of the most powerful moments in sports came from female athletes in 2020 including:
Becky Hammon as the acting head coach of the NBA’s San Antonio Spurs
Kim Ng named the first female GM in MLB
Sarah Fuller become the first woman to score in a Power Five college football game
Naomi Osaka winning the US Open and using her platform to draw attention to the racial injustice in the United States by wearing face masks with Breonna Taylor, Elijah McClain, Ahmaud Arbery, Trayvon Martin, George Floyd, Philando Castile, and Tamir Rice’s name on them.
The WNBA continues to use their platform to draw attention to social justice issues. From wearing #SayHerName shirts, to walking off the court to protest the shooting of Jacob Blake, to advocating for the political opponent of a team’s owner, the WNBA has proved that social justice is part of the fabric of the league.
Maya Moore, former WNBA player, helped overturn the wrongful conviction of Jonathan Irons.
Jessica Mendoza become the first female analyst in the MLB World Series.
While there is still room for improvement (yes professional golf I am referring to you), it is great to see progress.
This month, there were visualizations on biathlon, football (aka soccer), marathon, tennis, golf, hockey, iron”woman”, and the top 100 all-time female athletes. Bo McCready even got kudos from Brandi Chastain on his USWNT World Cup (soccer) goals visualization.
Here’s a round-up of the visualizations:
Branden Kornell @bkornell visualized the women's marathon world record

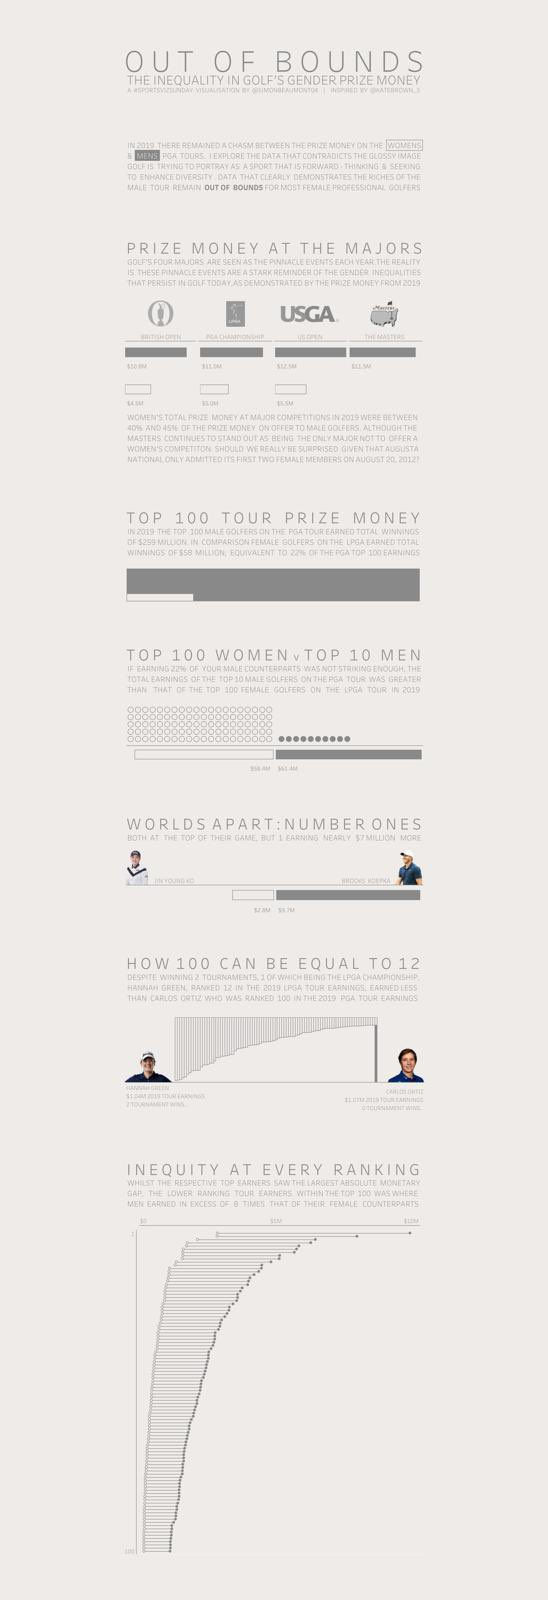
Simon Beaumont @SimonBeaumont04 visualized the gap between prize money on the PGA & LPGA tours
Piotr Szczes @SzczesPiotr created a visualization to learn more about the top 100 female athletes.

Nicolas Mieszaly @nmieszaly visualized history of gender equality in the summer Olympics
I love the small multiples chart.

Adam Green @greenynorfolk created a steam and leaf plot for @BarclaysFAWSL Women's Super League Football points

Christina Wiech @ChristinaWiech created her first Tableau public viz showing goals scored by state in the IIHF Women's World Championship. Christina also created a second visualization on Women's Super League goals & assists


Bo McCready @boknowsdata visualized every World Cup goal scored by the United States Women's National Team #USWNT from 1991-2019. Bo got a VOTD for this and he got a shout out from Brandi Chastain on Twitter for the viz.

Aashique S @aashique_s show us how successful Sania Mirza & Martina Hingis (aka Santina) were in tennis doubles.

CJ Mayes @_CJMayes created a visualiztion that showed Naomi Osaka's path to winning the US Open (tennis).

Eve Thomas @EveThomas1 visualized the female gold medal winners of the Ironman triathlon.

RJ Weise @rjweise created the first biathlon visualization I have seen. Check out this analysis of shooting speed.

Gorazd Surla @GorazdSurla used one of the data sets we provided to look at most popular sports among high school girls in US. Love the hex map on this one.

Thanks again to everyone for making my first "official" hosting a success.
Kate


Comments